To better understand how people use your website and to identify and test potential modifications to boost conversion rates, conversion rate optimization solutions collect data about your website and its visitors.
Increasing traffic is one of a website’s most crucial goals because it might eventually result in a rise in actual clients.
Only a well-optimized webpage can let you accomplish this. User experience, structure, SEO, and content are all areas you should pay close attention to. Yes, we are aware that there are numerous factors to take into account.
However, how will you be able to focus on everything? Web analytics holds the solution.
We’ll now demonstrate how to use analytics tools to drive traffic and boost conversion rates.
About the analysis
Website analytics is a technique for examining user experience, traffic, and visitor activity on a website. This is the procedure for gathering, analyzing, and summarizing data in order to determine activity, which includes the use of your website and all of its elements, including content and subpages.
You can gather data using this technique, including traffic sources, referring websites, page views, clicks or other interactions, and your conversion rate.
Let’s look at how this measurement can help you improve your website:
- You could boost your traffic.
- Your website UX can be enhanced.
- Lastly, you can increase your conversion rate.
Sound good, yes? The impact of hearing these comments will be seen in the daily operations of your online business. However, how are you able to perform these analyses?
You have access to a variety of instruments. A service like Google Analytics can be used to acquire quantitative data. You may create databases and establish patterns using this technique.
Although these are crucial since databases are valuable, we strongly advise using data visualization tools instead because they will deliver the most helpful information for a website.
But which tools are we primarily considering here? We’ll now demonstrate two methods for accurately analyzing visitor behaviour as well as the user experience and transparency of your online store.
Heatmap tools
The topic of why you should employ data visualization tools when a database can potentially give you a competitive advantage may first come to mind. There is an easy solution.
You can’t generate leads without a properly optimized website, thus you can’t rely your decision on quantitative data. You must also conduct qualitative analyses if you wish to drive traffic.
Heatmaps are ideal in this situation.
Heatmaps are tools for data visualization that display the most popular areas of your website. You can utilize it to determine which CTA or sub-page works best in terms of conversions.
The device displays warm colours in high-traffic areas and chilly hues in low-traffic areas.
With the aid of heatmaps, you can improve user experience, optimize your website, set the ideal CTAs on each button, and build a logical, transparent structure for your website or even simply your landing page.
All of these will contribute to an increase in both traffic and conversion rates.
We can tell apart a few heatmaps:
- Click
- Scroll
- Mouse tracking
- And Segment heatmap
When you want to find out how visitors are using your website, a click heatmap is a great tool to use. It enables you to observe which buttons receive the most clicks, visits, and conversions, as well as which product pages receive the most traffic.
Click heatmaps can be utilized in your advertisements as well as on your website to determine which CTAs are performing best. Because the creative components that worked well on your website will almost probably function well in your advertisement, you should also take a closer look at certain design elements.
Segment heatmaps can be used to determine where the majority of your traffic originates. You can monitor which channel generates the most leads.
In light of this, if you struggle to keep track of your purchases, you can utilize this information to help.
Scroll heatmaps are quite useful for blog interfaces because they let you place links to your items where they are most likely to be seen.
You can see the size of the advertisements that are shown on your page by using scroll heatmaps, which is another advantage. This will enable you to post advertisements in the busiest areas.
Heatmaps are crucial if you want to create leads, as you can see. With their assistance, you may significantly improve your webshop’s SEO while also seeing an increase in visits.
Yes, you make good sense. A greater conversion rate translates into more visitors.

Source: https://bestsocialsubmission.com/
Google Analytics
Because it provides gold-standard statistics and customer insights that help businesses manage their websites for greater conversions, Google Analytics is a crucial tool for conversion rate optimization.
It’s necessary to have a fundamental understanding of some key components of analytics and how their marriage with a set of essential conversion rate optimization tools can shoot up your conversions if you want to think like a CRO analyst and make significant data-backed decisions for your CRO program.
Let’s explore the most important component of analytics and conversion rate optimization to lay the groundwork for your journey.
Key reports you have to track
Standard preset reports in Google Analytics provide a plethora of information about data on all areas of your website. On the other hand, can only inform you of what is occurring on the website.
You must think about supporting conversion rate optimization solutions that allow you to examine your visitor behaviour for priceless insights.
They carry for your business in order to delve deeper into the “whys” of any specific data that Google Analytics collects regarding dimensions, metrics, events, etc. hence enabling you to thoroughly test these insights and profit from them without having to pay for additional traffic or wait for traffic that converts.
But what you should watch?
- Real-time data
- Data about your audience
- Source of your traffic
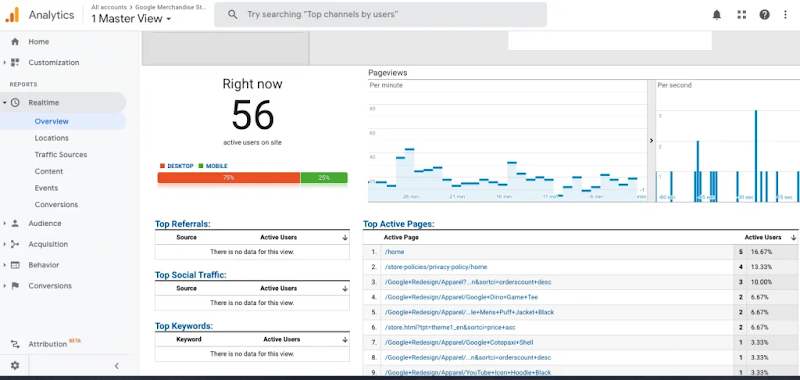
Real-time data
You can track the activity on your site in real-time with real-time reports.
These reports can be used to track real-time responses to a campaign and search for the potential for optimization in particular occasions, features, or content that is working.
With the knowledge gained from this report, you may use applications like VWO insights to readily comprehend the reasons behind the GA-collected data.
You can do an A/B test on your campaigns that were launched at various times to increase conversions while conducting an experiment and gathering evidence to support your theory.
Source: https://analytics.google.com/
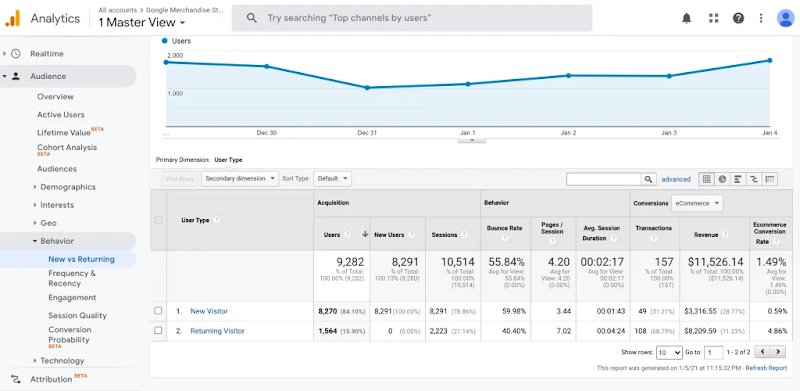
Data about your audience
Audience reports drill in on key information about your audience, as the name implies. Although this data is not real-time, its summary portion gives you a valuable snapshot of your audience.
The segments are broken down into 13 categories, including an overview, lifetime value, cohort analysis, active users, geographic location, audience demographics, interests…etc.
There are a ton of audience insights in this portion. You must, however, spend money on a visitor behaviour analysis conversion rate optimization solution like Capturly, which is the industry standard, if you want to comprehend what these data show.
For instance, let’s say you are aware that new visits to your website convert less effectively than repeat visitors or devoted consumers.
In that scenario, you must investigate a CRO possibility to improve conversions by comprehending the behaviour of the new visitor on your website.
To comprehend your users’ reservations when they first visit your website, use heatmaps, session recordings, and questionnaires.
The source of your traffic
Google Analytics’s acquisition reports will help you understand how users arrived at your website. The summary of this report, as shown in the image below, includes key information on how visitors arrived at your website.
As metrics for acquisition dimensions like direct, paid, display, affiliates, referral, and so forth, it displays the total number of visitors to the site as well as the number of users, new users, and sessions.
The six sections of these reports are Overview, All Traffic, Google Ads, Search Consoles, Social, and Campaign.
You can determine which social networks are sending you traffic by looking at your social landing page reports. The data displayed below includes the URL, sessions, page views, and session length.
By examining the heatmaps of the most popular landing page, you may assess user behaviour when they arrive on your website and make a data-driven decision.
Source: https://analytics.google.com/
Conclusion
The key to success in your conversion rate optimization is a solid understanding of analytics reports and Google Analytics integration with efficient CRO tools, but patience is required.
You may mine the data you have gathered for insights using tools like behaviour analysis and A/B testing, which will lead to the creation of practical, tried-and-true ideas for boosting conversion rates that put money in your pocket.
If conversion rate optimization is your primary objective, data visualization tools are unquestionably valuable. We advise using the aforementioned tools frequently so that you can be certain of success.
You can also mix the tools if you think it will help you see things more clearly.